

Turning complex land simulations into actionable insights
I restructured CIBO's Land Report around how people actually evaluate land, pairing every insight with geospatial context so non-scientists could understand, trust, and act on complex analysis.

Status
Shipped 2021
Contribution
Founding Product Designer
Product
CIBO Impact (Desktop App, Mobile App, iOS & Android)
Audience
Farmers, Land Owners, Land Buyers
Skills
UX Strategy & Foundational Design System
Early Concepts & Close Collab with Dev
User Research & Interviews
Rapid Prototyping & Testing
PROJECT OVERVIEW
CIBO builds agronomic and climate models to help people evaluate land value, productivity, and environmental impact. Its first beta product proved the technology worked, but the Land Report was difficult for users to navigate and interpret.
As CIBO's Founding Product Designer, I led the redesign of the Land Report, reorganizing the information around user priorities and integrating interactive maps directly into the analysis. I worked closely with a UX consultant who led our research and pilot interviews, as well as our engineering team.
Alongside this work, I collaborated with our UX consultant to develop CIBO's first design system, establishing reusable patterns and components across the product.
The redesigned Land Report shipped in March 2021.

CONTEXT
CIBO's 2020 beta proved its land simulation technology worked. But the Land Report was organized around the underlying scientific models, making it difficult for users to find and interpret the information they needed.
With the technology validated, our focus shifted to making the analysis useful to farmers, landowners, and buyers evaluating real properties.
INSIGHTS
Working with our UX consultant, who led the research, I participated in pilot interviews and card sorting to understand how people evaluated land and which information mattered most.
01
Scientific detail builds trust
Users valued precise, defensible results and wanted access to the science behind them.
02
More data does not mean more clarity
The volume of information made it difficult to identify what mattered most.
03
Different users had similar priorities
Farmers, landowners, and buyers all consistently focused on land value, productivity, and potential.

Together, these insights pointed to a single, underlying challenge:
How do we shift from a report structured around our scientific model to one structured around how people actually evaluate land?
Restructuring the Land Report
The original experience split land analysis across two reports, organized around CIBO's scientific models. Users had to understand how the data was categorized before they could find what they needed.
What are your reasons for researching farm land?
Purchase Land (44.1%)
Sell or Lease Land (40.7%)
Rent / Operate Land (35.6%)
Other* (37.3%)
*Top write-in answers included: Land Valuation (Check the value of my land and surrounding lands, appraisals), Develop ROI profiles, Financing land, Check sales history)
Highest Ranking Insights
(across all user types**)
-
Land Value
-
Productivity (Historic Performance / Yield)
-
Soil Types / Quality
-
Owner Information
-
Potential Yield / Improvements
** We also gathered information about priority insights for each type of user, however, we have not prioritized one group over the other, so overall insights took precedence.
Research showed that land value and productivity were top priorities, so I reorganized the report into sections that better reflected how people evaluated land.
While users prioritized value and productivity, regenerative potential was central to CIBO's strategy. We intentionally gave environmental insights greater prominence, balancing user needs with business priorities.
Before: Two Separate Reports

After: One Cohesive Report

Connecting the Report to the Map
In the beta experience, maps lived separately from the Land Report. Users had to move between the two to understand how simulation results applied to a specific property. I explored ways to bring them together, building on interactive map layers we'd already introduced in land search.
Direction 1: Split report and map view
Keeping both visible made geographic data easier to access, but left too little room for detailed report content.
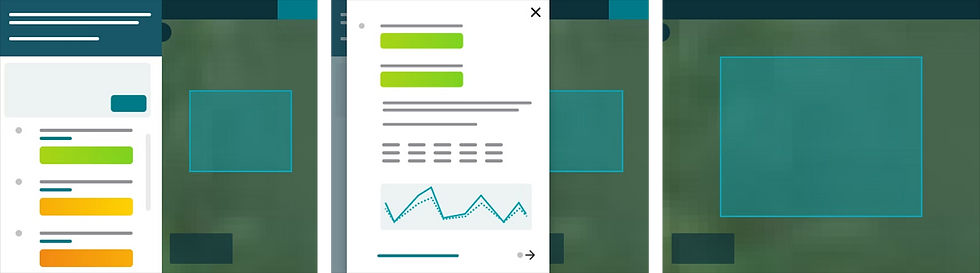
Direction 2: Simplified navigation
Removing the overview and introducing section navigation gave users more control over what they explored, while keeping the map accessible.

I developed this second approach into the final experience, pairing each report section with its corresponding interactive map data.
Adapting the experience for mobile
While most users accessed CIBO on desktop, research revealed another use case: bringing the Land Report into the field when visiting a property. The challenge was keeping the map and report connected without crowding a small screen.
My first concepts either separated the report from the map or introduced navigation controls that took up too much space.

I also tested a report drawer over the map, with lightweight navigation between sections. Users could move through the report without opening a full menu, while keeping the map accessible.

I developed this second approach into the final experience, pairing each report section with its corresponding interactive map data.
BRINGING IT ALL TOGETHER
The redesigned Land Report brought simulation results and geographic data into one experience, helping users understand both what the data meant and where it applied.

The original experience separated reports and maps across model-driven sections. The redesign brought everything into one report, organized information around user needs and paired each insight with its corresponding geographic data.

Each report section includes relevant interactive map layers, connecting property-level insights to specific areas of land.
The map and report work together

The new structure groups related insights around how people evaluate land, from value and productivity to environmental potential.
Information is easy to find

We replaced dense explanations with plain-language guidance, introduced consistent color cues, and let users dig into supporting scientific detail when they need it without forcing it on them when they don't.
Scientific results are easier to understand
OUTCOMES & REFLECTION
The redesigned Land Report shipped in March 2021, shortly before I left CIBO. As the company shifted toward enterprise products, the report structure and map-driven approach continued to inform its evolving platform.
This project taught me how to balance scientific complexity, user needs, and business priorities while working closely with researchers and engineers to turn sophisticated technology into a usable product.